Estimated time: 15 minutes

Pandas

pandas is derived from the term "panel data", an econometrics term for data sets that include observations over multiple time periods for the same individuals. — Wikipedia

The pandas package is the most important tool at the disposal of Data Scientists and Analysts working in Python today. Through pandas, you get acquainted with your data by cleaning, transforming, and analyzing it.

Simply, pandas can do anything you could imagine of with data.


DataFrame and Series

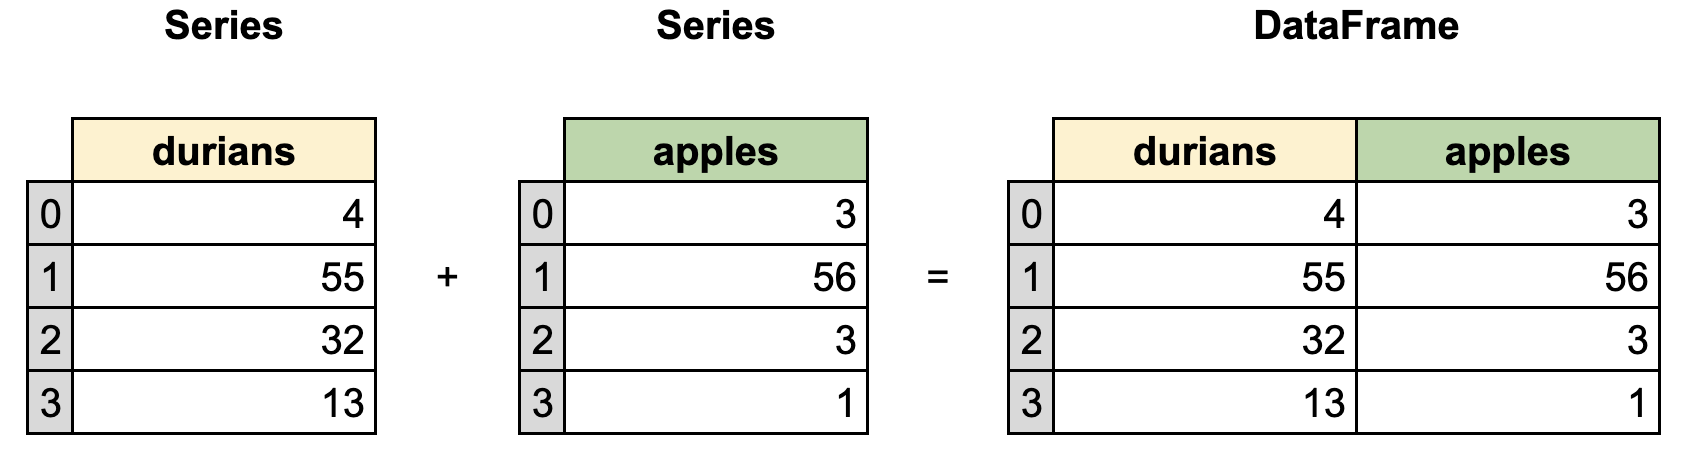
The primary two components of pandas are the Series and DataFrame. A Series is essentially a column, and a DataFrame is a multi-dimensional table made up of a collection of Series.

DataFrames and Series are quite similar in that many operations that you can do with one you can do with the other, such as filling in null values and calculating the mean.

Creating dataframe

import pandas as pd

data = {
    'durians': [4, 55, 32, 13], 
    'apples': [3, 56, 3, 1]
}

fruit = pd.DataFrame(data)
fruit
durians apples
0 4 3
1 55 56
2 32 3
3 13 1

Each item (key, value) in data corresponds to a column in the resulting DataFrame.

The Index of this DataFrame was given to us on creation as the numbers 0-3, but we could also create our own when we initialize the DataFrame.

Let's put customer names as our index:

fruit = pd.DataFrame(data, index=['Ali', 'Abu', 'Lim', 'Muthu'])

fruit
durians apples
Ali 4 3
Abu 55 56
Lim 32 3
Muthu 13 1

Locating the customer

We can locate a customer's order by using their name with loc.

fruit.loc['Ali']
durians    4
apples     3
Name: Ali, dtype: int64

Read CSV files

Reading CSV files is a single line to load in the data.

wget is a comment to retrieves content from web servers.

!wget http://gg.gg/fruit-csv -O fruit.csv
--2021-03-08 21:02:32--  http://gg.gg/fruit-csv
Resolving gg.gg (gg.gg)... 185.15.209.141
Connecting to gg.gg (gg.gg)|185.15.209.141|:80... connected.
HTTP request sent, awaiting response... 301 Moved Permanently
Location: https://gist.githubusercontent.com/khvmaths/a5eab33562c1a0e4d30901af8203784c/raw/505eca83251888c84c2b336be841aa5ea0f318f2/fruit.csv [following]
--2021-03-08 21:02:33--  https://gist.githubusercontent.com/khvmaths/a5eab33562c1a0e4d30901af8203784c/raw/505eca83251888c84c2b336be841aa5ea0f318f2/fruit.csv
Resolving gist.githubusercontent.com (gist.githubusercontent.com)... 185.199.110.133, 185.199.109.133, 185.199.108.133, ...
Connecting to gist.githubusercontent.com (gist.githubusercontent.com)|185.199.110.133|:443... connected.
HTTP request sent, awaiting response... 200 OK
Length: 53 [text/plain]
Saving to: ‘fruit.csv’

fruit.csv           100%[===================>]      53  --.-KB/s    in 0s      

2021-03-08 21:02:33 (1.81 MB/s) - ‘fruit.csv’ saved [53/53]

df = pd.read_csv('fruit.csv')
df
Unnamed: 0 durians apples
0 Ali 4 3
1 Abu 55 56
2 Lim 32 3
3 Muthu 13 1

CSV doesn't have indexes like DataFrames. So, we need to designate the index_col when reading.

df = pd.read_csv('fruit.csv',index_col=0)
df
durians apples
Ali 4 3
Abu 55 56
Lim 32 3
Muthu 13 1

The same goes for reading JSON, SQL, Excel file, etc. Basically you could read anything. Read more from the documentation here


Some more common operations that you should know!

Let's save our fruit.csv into JSON file.

df.to_json('fruit.json')

In Linux system, you could read a file contant through cat command.

!cat fruit.json
{"durians":{"Ali":4,"Abu":55,"Lim":32,"Muthu":13},"apples":{"Ali":3,"Abu":56,"Lim":3,"Muthu":1}}

Viewing few rows in large dataset

In a large file, you can't expect to print all the table, it would be very messy! Luckily, pandas allows to just look for the first few rows or the last few rows through head and tail.

!wget http://gg.gg/cov-1 -O covid19.csv
--2021-03-08 21:02:34--  http://gg.gg/cov-1
Resolving gg.gg (gg.gg)... 185.15.209.141
Connecting to gg.gg (gg.gg)|185.15.209.141|:80... connected.
HTTP request sent, awaiting response... 301 Moved Permanently
Location: https://raw.githubusercontent.com/CSSEGISandData/COVID-19/master/csse_covid_19_data/csse_covid_19_time_series/time_series_covid19_confirmed_global.csv [following]
--2021-03-08 21:02:34--  https://raw.githubusercontent.com/CSSEGISandData/COVID-19/master/csse_covid_19_data/csse_covid_19_time_series/time_series_covid19_confirmed_global.csv
Resolving raw.githubusercontent.com (raw.githubusercontent.com)... 185.199.109.133, 185.199.108.133, 185.199.111.133, ...
Connecting to raw.githubusercontent.com (raw.githubusercontent.com)|185.199.109.133|:443... connected.
HTTP request sent, awaiting response... 200 OK
Length: 516625 (505K) [text/plain]
Saving to: ‘covid19.csv’

covid19.csv         100%[===================>] 504.52K  1.41MB/s    in 0.3s    

2021-03-08 21:02:35 (1.41 MB/s) - ‘covid19.csv’ saved [516625/516625]

covid = pd.read_csv('covid19.csv')
covid.head()
Province/State Country/Region Lat Long 1/22/20 1/23/20 1/24/20 1/25/20 1/26/20 1/27/20 ... 2/26/21 2/27/21 2/28/21 3/1/21 3/2/21 3/3/21 3/4/21 3/5/21 3/6/21 3/7/21
0 NaN Afghanistan 33.93911 67.709953 0 0 0 0 0 0 ... 55696 55707 55714 55733 55759 55770 55775 55827 55840 55847
1 NaN Albania 41.15330 20.168300 0 0 0 0 0 0 ... 105229 106215 107167 107931 108823 109674 110521 111301 112078 112897
2 NaN Algeria 28.03390 1.659600 0 0 0 0 0 0 ... 112805 112960 113092 113255 113430 113593 113761 113948 114104 114234
3 NaN Andorra 42.50630 1.521800 0 0 0 0 0 0 ... 10822 10849 10866 10889 10908 10948 10976 10998 11019 11042
4 NaN Angola -11.20270 17.873900 0 0 0 0 0 0 ... 20759 20782 20807 20854 20882 20923 20981 21026 21055 21086

5 rows × 415 columns

covid.tail()
Province/State Country/Region Lat Long 1/22/20 1/23/20 1/24/20 1/25/20 1/26/20 1/27/20 ... 2/26/21 2/27/21 2/28/21 3/1/21 3/2/21 3/3/21 3/4/21 3/5/21 3/6/21 3/7/21
269 NaN Vietnam 14.058324 108.277199 0 2 2 2 2 2 ... 2426 2432 2448 2448 2475 2482 2488 2494 2501 2512
270 NaN West Bank and Gaza 31.952200 35.233200 0 0 0 0 0 0 ... 180848 181909 183612 185336 187309 189326 191203 193029 194548 196812
271 NaN Yemen 15.552727 48.516388 0 0 0 0 0 0 ... 2267 2269 2285 2310 2342 2363 2375 2411 2444 2473
272 NaN Zambia -13.133897 27.849332 0 0 0 0 0 0 ... 77639 78202 78534 79002 79557 80090 80687 81341 82011 82421
273 NaN Zimbabwe -19.015438 29.154857 0 0 0 0 0 0 ... 36044 36058 36089 36115 36148 36179 36223 36248 36260 36271

5 rows × 415 columns

Typically when we load in a dataset, we like to view the first five or so rows to see what's under the hood. Here we can see the names of each column, the index, and examples of values in each row.


Getting info about the data

.info() should be one of the very first commands you run after loading your data:

covid.info()
<class 'pandas.core.frame.DataFrame'>
RangeIndex: 274 entries, 0 to 273
Columns: 415 entries, Province/State to 3/7/21
dtypes: float64(2), int64(411), object(2)
memory usage: 888.5+ KB

.info() provides the essential details about your dataset, such as the number of rows and columns, the number of non-null values, what type of data is in each column, and how much memory your DataFrame is using.


Shape of the data

Another fast and useful attribute is .shape, which outputs just a tuple of (rows, columns):

covid.shape
(274, 415)

This means we have 247 rows with 415 columns in the DataFrame.


Duplicates

To demonstrate, let's simply just double up our movies DataFrame by appending it to itself.

covid_tmp = covid.append(covid)
covid_tmp.shape
(548, 415)

Using append() will return a copy without affecting the original DataFrame. Now, let's drop the duplicates.

covid_tmp = covid.drop_duplicates()
covid_tmp.shape
(274, 415)

It's a little verbose to keep assigning DataFrames to the same variable like in this example. For this reason, pandas has the inplace keyword argument on many of its methods. Using inplace=True will modify the DataFrame object in place. Another important argument for drop_duplicates() is keep, which has three possible options:

  • first: (default) Drop duplicates except for the first occurrence.
  • last: Drop duplicates except for the last occurrence.
  • False: Drop all duplicates.
covid_tmp.drop_duplicates(inplace=True, keep=False)

Columns

When we have a large dataset, we might forget the column name, with upper and lowercase words, spaces, and typos. To make selecting data by column name easier we can spend a little time cleaning up their names.

covid.columns
Index(['Province/State', 'Country/Region', 'Lat', 'Long', '1/22/20', '1/23/20',
       '1/24/20', '1/25/20', '1/26/20', '1/27/20',
       ...
       '2/26/21', '2/27/21', '2/28/21', '3/1/21', '3/2/21', '3/3/21', '3/4/21',
       '3/5/21', '3/6/21', '3/7/21'],
      dtype='object', length=415)

We can use the .rename() method to rename certain or all columns via a dict.

covid.rename(columns={
        'Province/State': 'Province', 
        'Country/Region': 'Country'
    }, inplace=True)
covid.columns
Index(['Province', 'Country', 'Lat', 'Long', '1/22/20', '1/23/20', '1/24/20',
       '1/25/20', '1/26/20', '1/27/20',
       ...
       '2/26/21', '2/27/21', '2/28/21', '3/1/21', '3/2/21', '3/3/21', '3/4/21',
       '3/5/21', '3/6/21', '3/7/21'],
      dtype='object', length=415)

Missing values

When exploring data, you’ll most likely encounter missing or null values, which are essentially placeholders for non-existent values. Most commonly you'll see Python's None or NumPy's np.nan, each of which are handled differently in some situations. We can use isnull() to check for missing values in our DataFrame.

covid.isnull()
Province Country Lat Long 1/22/20 1/23/20 1/24/20 1/25/20 1/26/20 1/27/20 ... 2/26/21 2/27/21 2/28/21 3/1/21 3/2/21 3/3/21 3/4/21 3/5/21 3/6/21 3/7/21
0 True False False False False False False False False False ... False False False False False False False False False False
1 True False False False False False False False False False ... False False False False False False False False False False
2 True False False False False False False False False False ... False False False False False False False False False False
3 True False False False False False False False False False ... False False False False False False False False False False
4 True False False False False False False False False False ... False False False False False False False False False False
... ... ... ... ... ... ... ... ... ... ... ... ... ... ... ... ... ... ... ... ... ...
269 True False False False False False False False False False ... False False False False False False False False False False
270 True False False False False False False False False False ... False False False False False False False False False False
271 True False False False False False False False False False ... False False False False False False False False False False
272 True False False False False False False False False False ... False False False False False False False False False False
273 True False False False False False False False False False ... False False False False False False False False False False

274 rows × 415 columns

Removing null values

We can remove the null value with dropna().

covid.dropna()
Province Country Lat Long 1/22/20 1/23/20 1/24/20 1/25/20 1/26/20 1/27/20 ... 2/26/21 2/27/21 2/28/21 3/1/21 3/2/21 3/3/21 3/4/21 3/5/21 3/6/21 3/7/21
8 Australian Capital Territory Australia -35.473500 149.012400 0 0 0 0 0 0 ... 118 118 118 118 120 120 120 120 122 122
9 New South Wales Australia -33.868800 151.209300 0 0 0 0 3 4 ... 5172 5177 5180 5183 5189 5193 5205 5207 5209 5210
10 Northern Territory Australia -12.463400 130.845600 0 0 0 0 0 0 ... 105 105 105 105 105 105 105 105 105 105
11 Queensland Australia -27.469800 153.025100 0 0 0 0 0 0 ... 1329 1329 1331 1335 1335 1342 1344 1347 1349 1356
12 South Australia Australia -34.928500 138.600700 0 0 0 0 0 0 ... 613 613 616 617 618 618 618 618 618 618
... ... ... ... ... ... ... ... ... ... ... ... ... ... ... ... ... ... ... ... ... ...
259 Gibraltar United Kingdom 36.140800 -5.353600 0 0 0 0 0 0 ... 4236 4238 4239 4239 4243 4243 4243 4244 4247 4249
260 Isle of Man United Kingdom 54.236100 -4.548100 0 0 0 0 0 0 ... 475 484 484 486 494 511 546 605 676 757
261 Montserrat United Kingdom 16.742498 -62.187366 0 0 0 0 0 0 ... 20 20 20 20 20 20 20 20 20 20
262 Saint Helena, Ascension and Tristan da Cunha United Kingdom -7.946700 -14.355900 0 0 0 0 0 0 ... 4 4 4 4 4 4 4 4 4 4
263 Turks and Caicos Islands United Kingdom 21.694000 -71.797900 0 0 0 0 0 0 ... 2088 2099 2114 2114 2115 2132 2161 2172 2177 2177

84 rows × 415 columns

This operation will delete any row with at least a single null value, but it will return a new DataFrame without altering the original one. You could specify inplace=True in this method as well.

covid.dropna(inplace=True)
covid.shape
(84, 415)

Other than just dropping rows, you can also drop columns with null values by setting axis=1.

covid.dropna(axis=1,inplace=True)
covid.shape
(84, 415)

Understanding our data

Using describe() on an entire DataFrame we can get a summary of the distribution of continuous variables.

covid['1/22/20'].describe()
count     84.000000
mean       6.523810
std       48.442358
min        0.000000
25%        0.000000
50%        0.000000
75%        1.000000
max      444.000000
Name: 1/22/20, dtype: float64